Sake Facts – Some Current Sake Statistics
Facts are actually hard to come by in the sake world. No, I’m not saying that this is an industry of half-truths and white lies, it’s quite the opposite! Facts in terms of how much sake is actually out there! Huh? In all of my time in the sake world the one common theme is that nobody can really pinpoint an actual figure for importing and exporting sake statistics
I often get emails from my peers asking me if I have any solid numbers that can be used for their education and presentation programs. I then turn to ask somebody and then they ask somebody and we are all chasing industry statistics that are as slippery as an eel. Hmmmmm! Every once in a while a nugget gets passed my way from some Japanese Governmental organization. Or the Japanese Sake Brewers Association will cough up some statistics that shed some light. More often than not, the information is at a minimum three years old. Great!
So you could imagine my surprise when I was in Kobe in May for the International Wine Challenge, and was handed a document called, “Promoting Japanese attractiveness to the world through Japanese liquors.” My jaw dropped and I had to read on. There were three bullet points – Export and Import Statistics (BINGO!) –
Approaches to develop the environment for export of Japanese liquors – Geographical Indictation (GI) “Nihonshu.” Oh my God! Who? What? What the? And then I saw the source – 2016/05/19 National Tax Agency! Another BINGO! Because only the tax department has any real sense of these numbers in Japan.
So what did I learn? I learned pretty much what I had thought and had been told by word of mouth for the past decade that sake exports have been on the rise since at least 2006. There was a hiccup in 2009, but this was a world hiccup so it was understood. I also learned that 2015 was a monster year for sake exports!
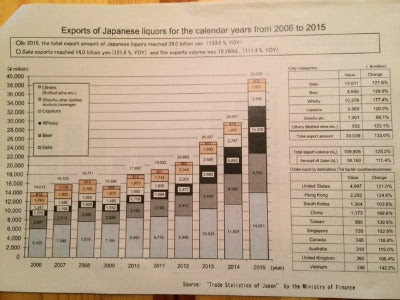
Starting in 2010, sake exports grew from 8.5 billion yen to 14 billion yen in 2015. That is a pretty good trajectory and if ’15 is any indicator of ’16 then growth looks to be even greater by a lot! 14 billion yen is a 122% increase over 2014. Holy Molly! For all you volume geeks the export volume of sake in 2015 was 18,180kl, which was a 111% increase over 2014. So where does all of this delicious sake go? I am so glad that you asked!
Almost 5 billion yen worth of sake came our way! 4,997 billion yen was a 121% increase over 2014, and that my friend is quite a jump! As a retailer let me stop right here and say THANK YOU! Sake doesn’t buy itself! The second largest sake export destination was Hong Kong with 2,282 billion yen, followed by South Korea (1,364 billion) China (1,173) Taiwan (890) Singapore (526) Canada (345) Australia (310) UK (260) and Vietnam (248). Yes the US represents the lion’s share, but many brewers have told me that this will not continue and China will soon be the top dog.
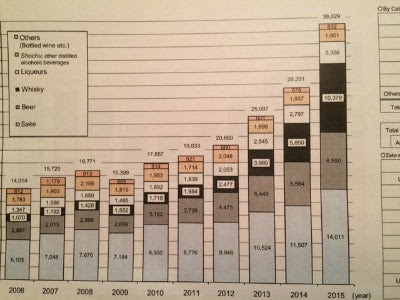
Me thinks that the Japanese government is reading the writing on the wall as all exported boozes (sake, beer, whiskey, liquors, others including wine) accounted for 39 billion yen in taxable exports! Wowza! So it is no wonder that we are now seeing all of these efforts by governmental agencies to promote sake overseas! They are actually funding certain restaurant groups etc., to go set up shop overseas to be destinations for all of this Japanese booze. I just wish that they would float some yen to businesses such as True Sake that have been peddling rice and water for over 13 years now! But that’s a different discussion all together.
Thank you so much “Trade Statistics of Japan” by the Ministry of Finance for giving me some sake facts that I can pass on to peers and then they can pass on and on and on!